
Visualizer for Jira
- Jira Service Management
- Jira Software
We no longer offer sales and support for server apps. You can stay connected by exploring the migration options to either the cloud or Data Center version of this app.
Visualizer displays your issues, organized visually using projects, issue types, sprints, assignees, or any custom field
Discover
Visualizer’s zooming, scrolling canvas of issues helps you discover naturally occurring patterns in issues and workflows to find connections and hidden outliers.
Explore
Any Jira fields can be used to group your issue “cards” along X and Y axes, and by color or size. You can explore your team’s performance or your Jira data across multiple dimensions.
Enhance
Visualizer enhances the primarily text-based reporting and charting built into Jira by turning your favorite filters and JQL into revealing visualizations.
More details
Configuration
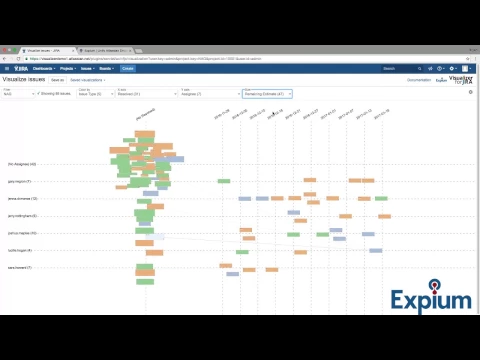
The process is driven by a configuration panel at the top of the page. As soon as you change any of the settings, the visualization will be updated to match your configuration.
Filter and query
The filter and query define what issues will be visualized. Choose between a custom query or any of your favorite filters.
Visualization
The remaining configuration controls define how the issues are visualized. You can use color, position on screen, card size and caption to represent fields of your choice. For example, you may color issues by assignee, order them by creation date on one axis and by issue type on another, and make issues with bigger estimates larger - all at the same time.
- Color
- X and Y axes
- Size
- Issue links
Tweaking the visualization
Click the cog icon on the right hand side to expand a drop-down menu with advanced visualization options.
- Showing all fields
- Axis spacing
- Grouping preference
- Physics parameters
Privacy and security
Privacy policy
Atlassian's privacy policy is not applicable to the use of this app. Please refer to the privacy policy provided by this app's partner.
Partner privacy policyResources
Gallery
Start out with a visual representation of all of your issues, grouped together by issue links.