
OVERALL RATINGS
INSTALLS
195
SUPPORT
- Partner Supported
TRUST SIGNALS
Key highlights of the appAgile WIP aging & run charts: multi-team Work in Progress charts/reports for Scrum/Kanban, Epics, Projects, Releases, SAFe in Jira
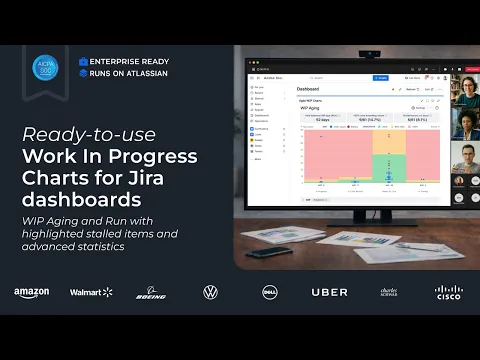
Real-time WIP aging & run charts directly in Jira
Spot bottlenecks, track WIP aging work items with auto-calculated health zones, highlight stalled items, monitor trends on WIP run charts, and set targets/RAG thresholds - directly in Jira Dashboard.
Beginner-friendly & highly customizable WIP charts
Start from templates, then adapt to your teams' flow: choose what counts as “work in progress”, tune aging zones, slice WIP by any field, add health metrics/targets, and share/export from one gadget.
Get the full Agile reporting in one subscription:
Combine WIP charts, Created vs Resolved, Velocity, Cycle Time, Burnup/Burndown, CFD, Monte Carlo forecasting, and Throughput on one Jira dashboard. Keep your existing dashboards and saved charts - no rework.
Supporting media
Editions
This app offers two different editions - Standard and Advanced. You can start a free trial of either edition, and change your edition anytime during or after the trial.
Standard
Onboard your team and scale fast
Includes:
Work In Progress (WIP) & Aging
Auto-Calculated Health Zones
Stalled Items
Targets/Highlights
Run Chart
Advanced
Unlock the full range of app features
Everything from Standard, plus:
Operational SLA & Priority Queue
Strategic Enablement Sessions
Migration & Rollout Assistance
More details
🎓Get started | 💻Book a Demo | 🛠Support
Enterprise-ready Agile WIP Charts by Broken Build bring real-time work-in-progress visibility into a single Jira gadget, combining WIP Aging and WIP Run charts with flexible configuration and a ready-to-use setup.
✨ Key capabilities:
- Multiple data sources: Scrum/Kanban boards, projects, releases, epics, SAFe, JQL
- WIP Aging chart: track how long work stays in progress & identify stalled items
- WIP Run chart: visualize how much work is in progress over time & spot trends, variability, or potential overload
- Highlights: percentile-based aging zones to highlight risks
- Health metrics: assess instant performance insights displayed above the chart
- Breakdown: analyze workload distribution by any issue field
- Issue list: the proof behind the numbers on the chart
Ideal for SAFe and multi-team environments to monitor WIP, improve flow stability, and make data-driven decisions - directly in Jira.
Resources
App documentation
Comprehensive set of documentation from the partner on how this app works
Privacy and Security
Privacy policy
Atlassian's privacy policy is not applicable to the use of this app. Please refer to the privacy policy provided by this app's partner.
Partner privacy policySecurity program
This app is part of the Marketplace Bug Bounty program.
About Bug Bounty programIntegration permissions
Agile WIP charts for Scrum, Kanban, SAFe (Gadgets Reports) integrates with your Atlassian app
Version information
Version 2.2.0•for Jira Cloud
- Release date
- May 8th 2026
- Summary
- Stability improvements and bug fixes
- Details
This release includes:
- PNG/PDF export fix
- App crashes when the board fails to load on the project page fix
- Resolution displayed in the issue list fix
- and more
- Payment model
- Paid via Atlassian
- License type
- Commercial