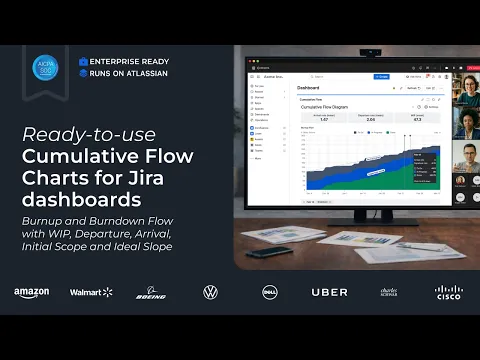
Cumulative Flow Diagrams/CFD for Scrum/Kanban (Agile Charts)

Additional time may be available from the app vendor.
About Data Center trials
OVERALL RATINGS
INSTALLS
3
SUPPORT
- Partner Supported
Key highlights of the appAgile CFD/Cumulative Flow Diagrams for Scrum/Kanban, Projects, Releases, SAFe: burnup/burndown charts/gadgets on Jira Dashboard
Real-time flow & system health reporting in Jira
Analyze flow using a status-based Agile Cumulative Flow Diagram (CFD). Group statuses into custom bands, track arrival vs departure trends compared to ideal pace, and initial scope line, directly in Jira.
Beginner-friendly & highly customizable CFD charts
Start from templates, then tailor the Cumulative flow chart to your workflow: group statuses into bands, set time-frame and units, break down by any field, and share/export from one Jira gadget.
Get the full Agile reporting in one subscription:
Combine CFD, Burnup/Burndown, Throughput, Velocity, Cycle Time, Monte Carlo forecasting, WIP, and Created vs Resolved charts on one Jira dashboard. Keep your existing dashboards and saved charts - no rework.
Supporting media
More details
🎓Get started | 📊Interactive playground | 💻Book a Demo | 🛠Support
Enterprise-ready Agile Cumulative Flow Charts by Broken Build bring real-time flow visibility into a single Jira gadget, combining Burnup/Burndown flow charts with flexible configuration for any workflow & a fast setup.
✨ Key features:
- Multiple data sources: Scrum/Kanban, projects, releases, epics, SAFe, JQL filters
- Burnup flow chart: visualize inflow, outflow & WIP over time to spot bottlenecks & flow stability
- Burndown flow chart: compare actual progress to the ideal slope, track remaining scope & spot flow risks
- Calculation rules: define estimation field & bands logic (custom statuses)
- Health metrics: track Arrival/Departure rates & WIP directly on your CFD for quick validation of flow stability
- Breakdown & issue list: segment data by any issue field & drill down to Jira issues
Built for multi-team and enterprise environments, enabling consistent Agile CFD in Jira Dashboard.
Resources
Download
Get the .jar file downloaded to your system
App documentation
Comprehensive set of documentation from the partner on how this app works
Privacy and Security
Privacy policy
Atlassian's privacy policy is not applicable to the use of this app. Please refer to the privacy policy provided by this app's partner.
Partner privacy policySecurity program
This app is not part of the Marketplace Bug Bounty program.
Version information
Version 1.0.0•for Jira Data Center 8.20.0 - 11.1.1
- Release date
- Oct 31st 2025
- Summary
- Cumulative Flow Charts based on statuses, categories, and custom groups
- Details
We created the Cumulative Flow Charts app, which can show you the flow diagram for any data source (Scrum or Kanban boards, Projects, Releases, Epics, Initiatives, custom JQL, etc.) and any timeframe you need—from days to years.
Key charts and app features:
- Cumulative Flow Diagram based on status categories with Arrival and Departure lines
- Cumulative Burndown Flow chart based on statuses with Initial scope and Ideal slope lines
- Cumulative Flow Diagram based on statuses with relative values
- Active sprint Cumulative Burndown Flow chart with Initial scope and Ideal slope lines
- Health Metrics: Arrival, Departure, and WIP rate based on the selected statistics approach
- Custom status groups
- Payment model
- Paid via Atlassian