ConfluOps - AWS CloudWatch Dashboards & Alarms in Confluence
OVERALL RATINGS
INSTALLS
1
SUPPORT
- Partner Supported
Key highlights of the appEmbed AWS CloudWatch dashboards and alarm badges in Confluence
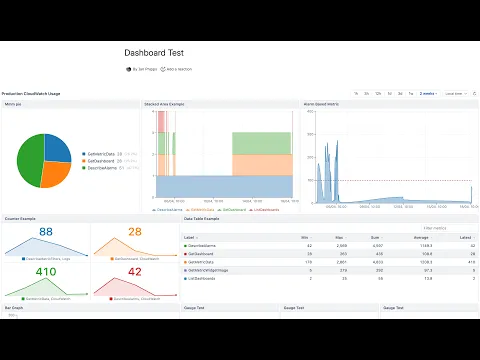
AWS CloudWatch dashboards in Confluence
Embed any CloudWatch dashboard as a live, interactive widget. Supports metric charts, pie, gauge, counters, alarm grids, data tables, and Markdown text. Multi-account support and configurable auto-refresh included.
AWS CloudWatch alarm statuses in Confluence
Build status pages without opening AWS! Color-coded CloudWatch alarm badges embedded in Confluence. Custom labels, flexible positioning, and auto-refresh options.
Customize how your alarm badge looks on the page
Control how your alarm badge appears: set a custom label, choose label position, pick alignment, and optionally configure auto-refresh so the status updates automatically while your team views the page.
Supporting media
More details
Key Features
- Embed any CloudWatch dashboard as a live, interactive widget with metric charts, pie charts, gauges, counters, alarm grids, and Markdown text
- Display individual CloudWatch alarms as color-coded status badges (OK, ALARM, INSUFFICIENT DATA)
- Multi-account support: connect multiple AWS accounts and mix widgets from different accounts on a single page
- Secure cross-account access via IAM role assumption with a unique External ID per account
- Configurable auto-refresh keeps data current while viewers have the page open
How It Works
ConfluOps connects to your AWS accounts using IAM role assumption. Dashboard and alarm data is fetched live on page load and displayed inline. No data is cached or stored outside Atlassian's Forge infrastructure.
Requirements
AWS account with CloudWatch dashboards or alarms
Permission to create an IAM role in your AWS account (or to supply IAM User access keys)
Language Support
English
Resources
App documentation
Comprehensive set of documentation from the partner on how this app works
Privacy and Security
Privacy policy
Atlassian's privacy policy is not applicable to the use of this app. Please refer to the privacy policy provided by this app's partner.
Partner privacy policySecurity program
This app is not part of the Marketplace Bug Bounty program.
Integration permissions
ConfluOps - AWS CloudWatch Dashboards & Alarms in Confluence integrates with your Atlassian app
Version information
Version 3.5.0•for Confluence Cloud
- Release date
- Apr 19th 2026
- Summary
- Minor version update
- Details
ConfluOps v3.5.0 - Release notes
Charts & Zoom
- Free-form drag-to-zoom — zoom selection is no longer snaps to closest data-point
- Trackpad pan when zoomed — horizontal swipe (or Shift+scroll) pans left/right within the zoomed window
- Pinch-to-zoom — two-finger pinch gesture on touch devices zooms in/out
- Grid lines and time axis now render correctly when zoomed between datapoints
- Tooltip and dots suppressed outside the zoom domain — no more ghost values appearing at the edges
Time Range
- Zoomed pill — clicking the "Zoomed" chip resets zoom; hovering shows the zoomed time range in a tooltip
- Time range bar shows a tooltip on the active preset button
Widget Improvements
- Expand to modal — widget title bars now have an expand button (⛶) that opens the widget in a larger overlay
- Resizable table columns — drag the right edge of any column header to resize it
- Gauge hover tooltip — shows the current value, range, and which threshold zone it falls in
- Payment model
- Paid via Atlassian
- License type
- Commercial