
OVERALL RATINGS
INSTALLS
517
SUPPORT
- Partner Supported
TRUST SIGNALS
Key highlights of the appAgile Monte Carlo (MC) forecasting: When/How many charts for Scrum/Kanban, Projects, SAFe gadgets/reports/KPIs on Jira Dashboard
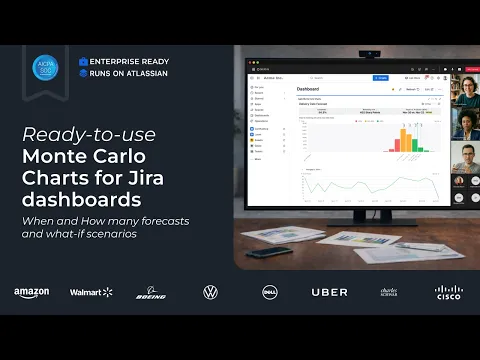
Real-time Monte Carlo forecasting in Jira
Run Monte Carlo simulations (When, How many). Forecast initiatives & epics, estimate projects, simulate capacity changes, compare forecast ranges to your plan, and explore what-if scenarios - directly in Jira.
Beginner-friendly & highly customizable MC charts
Start from templates, choose the scope, model forecasting simulation sources, filter remaining work via JQL, handle not-estimated items, and share/export from one gadget.
Get the full Agile reporting in one subscription:
Combine Monte Carlo forecasting, WIP charts, Created vs Resolved, Velocity, Cycle Time, Burnup/Burndown, CFD, and Throughput on one Jira dashboard. Keep your existing dashboards and saved charts - no rework.
Supporting media
Editions
This app offers two different editions - Standard and Advanced. You can start a free trial of either edition, and change your edition anytime during or after the trial.
Standard
Onboard your team and scale fast
Includes:
Monte Carlo Forecast (When & How Many)
Initiative-Level Forecasting
Epic Estimate
Alternative Throughput
Capacity Allocation Simulation
Advanced
Unlock the full range of app features
Everything from Standard, plus:
Operational SLA & Priority Queue
Strategic Enablement Sessions
Migration & Rollout Assistance
More details
🎓Get started | 📊Interactive playground | 💻Book a Demo | 🛠Support
Enterprise-ready Agile Monte Carlo Charts by Broken Build bring real-time forecasting simulation into a single Jira gadget, combining Monte Carlo When and How many charts with flexible configuration and a ready-to-use setup.
✨ Key capabilities:
- Multiple data sources: Scrum/Kanban boards, projects, releases, epics, SAFe, and JQL
- When chart: predict delivery dates with probabilistic forecasts
- How many chart: forecast scope completion and delivery capacity
- Historical(default) or alternativethroughput data to ensure stability
- Remaining work modeling via estimation field (e.g., Story Points), “What-if” numbers, or JQL filters
- Health metrics: get instant insights displayed above the chart
- Chances& targets: probability percentiles and goals for delivery confidence and risk visibility
Ideal for SAFe and multi-team environments to make data-driven delivery decisions directly in Jira.
Resources
App documentation
Comprehensive set of documentation from the partner on how this app works
Privacy and Security
Privacy policy
Atlassian's privacy policy is not applicable to the use of this app. Please refer to the privacy policy provided by this app's partner.
Partner privacy policySecurity program
This app is part of the Marketplace Bug Bounty program.
About Bug Bounty programIntegration permissions
Monte Carlo simulations for Scrum/Kanban (Agile Gadgets) integrates with your Atlassian app
Version information
Version 2.6.0•for Jira Cloud
- Release date
- Jun 11th 2026
- Summary
- Time tracking & Breakdown for completed work
- Details
- Payment model
- Paid via Atlassian
- License type
- Commercial