OVERALL RATINGS
INSTALLS
3
SUPPORT
- Partner Supported
TRUST SIGNALS
- Requires
- CONFLUENCE
- Works with
- JIRA
Key highlights of the appLive pie, donut, bar and KPI charts of Jira data on Confluence pages, from a project, filter or JQL, with no IDs to remember
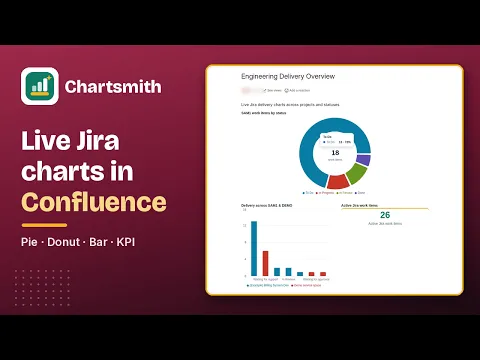
Build a live Jira chart in a few clicks
Pick a project, saved filter, project type, project category or custom JQL, then choose pie, donut, bar, stacked bar or a KPI number. The live preview updates as you set colours, top N and height.
Five ways to find your data, no IDs to remember
Chart a project, saved filter, project type, project category or custom JQL. Pickers search as you type, and JQL autocompletes fields, operators and values, showing Jira’s own message if a query is wrong.
Every viewer, their own Jira permissions
Each chart is built from the work items the viewer can see in Jira. No database, no app storage and no copy of your Jira data; chart settings live in the page. Nothing leaves Atlassian. Runs on Atlassian.
Supporting media
More details
Confluence has no built-in way to chart live Jira data - Chartsmith adds one. Insert the macro on any page and a full-screen editor opens with a live preview. Point it at a project, saved filter, custom JQL search, project type or project category, with no IDs to remember: pickers search as you type, and JQL autocompletes fields, operators and values, showing Jira’s own message when something is wrong. Choose pie, donut, bar, stacked bar or a KPI number; chart by any field, including custom fields; style it with a colorblind-checked palette, per-group colors and top-N grouping with an automatic Other rollup. Height and compact-spacing options tile several charts side by side in page columns. Every viewer sees the chart built from their own Jira permissions. The app stores nothing and nothing leaves Atlassian. Free for up to 10 users, with a 30-day free trial. Setup guide: https://chartsmith.wattlebrooks.com/docs/
Resources
App documentation
Comprehensive set of documentation from the partner on how this app works
Privacy and Security
Privacy and security questionnaire has been filled by the partner
Privacy policy
Atlassian's privacy policy is not applicable to the use of this app. Please refer to the privacy policy provided by this app's partner.
Partner privacy policySecurity program
This app is not part of the Marketplace Bug Bounty program.
Integration permissions
Chartsmith - Charts for Confluence with Jira Data integrates with your Atlassian app
Version information
Version 2.0.0•for Confluence Cloud
- Release date
- Nov 3rd 2026
- Summary
- First release: live Jira charts on Confluence pages, each viewer's own data
- Details
- Pie, donut, bar, stacked bar and KPI charts of live Jira data on Confluence pages
- Chart a project, saved filter, custom JQL, project type or project category
- Search-as-you-type pickers and JQL autocomplete with Jira's own error messages
- Chart by or stack by any field, including custom fields
- Every viewer sees chart data filtered to their own Jira permissions
- Colorblind-checked palette, per-group colors, top-N with an Other rollup, height and compact spacing
- Stores nothing and runs on Atlassian, with no data leaving your site
- Payment model
- Paid via Atlassian
- License type
- Commercial