
OVERALL RATINGS
INSTALLS
459
SUPPORT
- Partner Supported
TRUST SIGNALS
Key highlights of the appAgile Created vs Resolved charts: multi-team created vs resolved issues reports/gadgets for Projects/Epics/Releases/SAFe in Jira
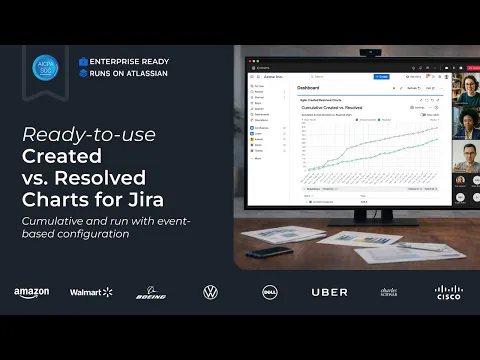
Real-time demand vs delivery reporting in Jira
Compare created vs resolved work, track cumulative intake vs completion, configure arrival/departure events, view trends by period (lines or bars), and break down by any field to see where capacity is going.
Beginner-friendly and highly customizable
Start from template, select data source and one/multiple boards (Scrum/Kanban, etc.). Then choose events and transitions, switch between cumulative and by-period views, share/export from one gadget.
Get the full Agile reporting in one subscription:
Combine Created vs Resolved, Velocity, Cycle Time, Burnup/Burndown, CFD, Monte Carlo forecasting, Throughput, and WIP charts on one Jira dashboard. Keep your existing dashboards and saved charts - no rework.
Supporting media
Editions
This app offers two different editions - Standard and Advanced. You can start a free trial of either edition, and change your edition anytime during or after the trial.
Standard
Onboard your team and scale fast
Includes:
Created vs Resolved Trends
Configurable Arrival & Departure Events
Breakdown to See Where Capacity Goes
Cross-Product Compatibility
Any Data Source
Advanced
Unlock the full range of app features
Everything from Standard, plus:
Operational SLA & Priority Queue
Strategic Enablement Sessions
Migration & Rollout Assistance
More details
🎓 Get started |💻 Book a Demo | 🛠 Support
Agile Created Resolved Charts by Broken Build brings demand vs delivery insights into one Jira gadget with flexible configuration and a ready-to-use setup.
✨ Key features:
- Multiple data sources: Scrum/Kanban boards, projects, releases, epics, SAFe, and JQL filters
- Cumulative chart: understand long-term flow stability, backlog pressure, and overall system health
- By-period (run) chart: spot growing queues, uneven intake, or delivery bottlenecks
- 2 chart types: Line charts to show trends or Bar charts to highlight discrete intervals
- Calculation rules: set estimation fields, default estimates, arrived/resolved transitions
- Breakdown: assess where the capacity goes
- Issue details: drill down into Jira issues to investigate anomalies
Ideal for Scrum sprints, Kanban workflows, and multi-team SAFe® environments to visualize real-time Created vs Resolved charts on your Jira dashboard.
Resources
App documentation
Comprehensive set of documentation from the partner on how this app works
Privacy and Security
Privacy policy
Atlassian's privacy policy is not applicable to the use of this app. Please refer to the privacy policy provided by this app's partner.
Partner privacy policySecurity program
This app is part of the Marketplace Bug Bounty program.
About Bug Bounty programIntegration permissions
Created vs Resolved charts for Scrum, Kanban (Agile Reports) integrates with your Atlassian app
Version information
Version 3.5.0•for Jira Cloud
- Release date
- Jun 5th 2026
- Summary
- Maintenance release
- Details
Maintenance release
- Payment model
- Paid via Atlassian
- License type
- Commercial