
OVERALL RATINGS
INSTALLS
456
SUPPORT
- Partner Supported
TRUST SIGNALS
Key highlights of the appAgile Throughput Charts: Throughput run and histogram charts/graphs/diagrams for multi-team throughput analytics in Jira Dashboard
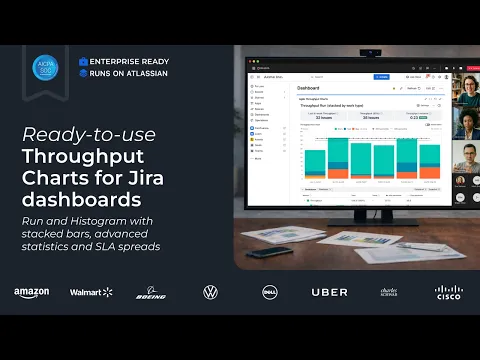
Real-time throughput reporting directly in Jira
Measure completed work over time to reveal true delivery capacity. Use throughput run and histogram charts, segment results by any Jira field, set targets/RAG thresholds, and drill down to issue lists.
Beginner-friendly and highly customizable
Start from template, select data source and one/multiple boards (Scrum/Kanban, etc.). Tailor the metric: define “done” statuses, add SLA highlights and health metrics, share/export from one gadget.
Get the full Agile reporting in one subscription:
Combine Throughput, Velocity, Cycle Time, Burnup/Burndown, Monte Carlo forecasting, CFD, WIP, and Created vs Resolved charts on one Jira dashboard. Keep your existing dashboards and saved charts - no rework.
Supporting media
Editions
This app offers two different editions - Standard and Advanced. You can start a free trial of either edition, and change your edition anytime during or after the trial.
Standard
Onboard your team and scale fast
Includes:
Throughput & Completion Rate
Custom Throughput Configuration
Segmentation by Any Field
SLA Highlights on Histogram
Cross-Product Compatibility
Advanced
Unlock the full range of app features
Everything from Standard, plus:
Operational SLA & Priority Queue
Strategic Enablement Sessions
Migration & Rollout Assistance
More details
🎓 Get started | 📊 Interactive playground |💻 Book a Demo | 🛠 Support
Agile Throughput Charts by Broken Build brings 2 essential charts in one gadget. Get powerful throughput analytics in Jira with a ready-to-use setup and flexible configuration.
🌟 Key capabilities:
- Multiple data sources: Scrum/Kanban boards, projects, releases, epics, SAFe, and JQL
- Throughput run chart: visualize patterns in output and highlight where capacity is spent
- Throughput histogram: analyze throughput distribution and understand predictability
- Calculation rules: define “Done”, set estimation fields, default estimates, and custom resolutions
- Health metrics, targets, & highlights: monitor performance and delivery health
- Segmentation&issue details: break down results by any issue field and drill down to Jira issues for deeper insights
Built for multi-team and enterprise environments, enabling consistent throughput reports in Jira Dashboard - all in one gadget.
Resources
App documentation
Comprehensive set of documentation from the partner on how this app works
Privacy and Security
Privacy policy
Atlassian's privacy policy is not applicable to the use of this app. Please refer to the privacy policy provided by this app's partner.
Partner privacy policySecurity program
This app is part of the Marketplace Bug Bounty program.
About Bug Bounty programIntegration permissions
Throughput Charts for Scrum, Kanban, SAFe (Gadgets Reports) integrates with your Atlassian app
Version information
Version 2.4.0•for Jira Cloud
- Release date
- Jun 5th 2026
- Summary
- Maintenance release
- Details
Maintenance release
- Payment model
- Paid via Atlassian
- License type
- Commercial