Free app
OVERALL RATINGS
INSTALLS
37
SUPPORT
- Partner Supported
TRUST SIGNALS
Key highlights of the appJSM reporting and dashboards for SLA, time in status, CSAT, response and resolution time, backlog, aging and workload
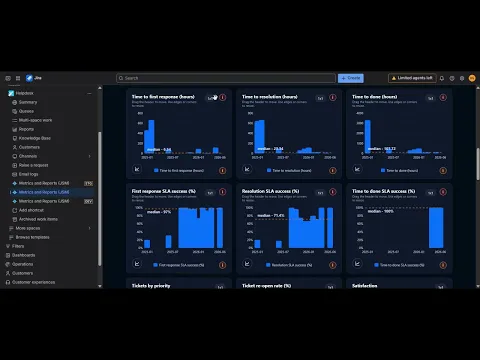
JSM SLA, CSAT & Time in Status Reports
Track SLA success, first response, resolution, CSAT, time in status, backlog, aging and workload from any JQL.
Interactive Reports with Jira Drill-Down
Explore charts and tables by day, month, quarter or year. Click a metric or chart bucket to see the Jira work items behind the result.
Save Queries & Export PDF Reports
Reuse saved report configurations and export the completed report as a shareable PDF with executive summary, filters and charts.
Supporting media
More details
Metrics and Reports for Jira Service Management (JSM) by SolveroX turns any JQL into interactive service-management reports and dashboards.
Track SLA performance, time to first response, resolution and done, time in status (report status times individually or as groups), CSAT, re-open rate, backlog, aging, workload, priorities, request types, resolution types and selected custom fields.
Use Ticket Creation Date for cohort/service-quality analysis or Event Based for operational reporting aligned as closely as possible with Jira/JSM native report behavior.
Drill into each metric to see contributing work items, reuse saved report configurations, and export reports as PDF.
Runs on Atlassian infrastructure and respects the viewing user's Jira permissions.
Resources
App documentation
Comprehensive set of documentation from the partner on how this app works
Privacy and Security
Privacy policy
Atlassian's privacy policy is not applicable to the use of this app. Please refer to the privacy policy provided by this app's partner.
Partner privacy policySecurity program
This app is not part of the Marketplace Bug Bounty program.
Integration permissions
Metrics and Reports for Jira Service Management (JSM) integrates with your Atlassian app
Version information
Version 4.16.0•for Jira Cloud
- Release date
- Sep 29th 2026
- Summary
- Save your queries, save your reports, get clear insights - faster
- Details
- You can save your queries and re-use them
- You save your reports and share them with your internal teams or customers
- Faster report generations
- Payment model
- Free
- License type
- Commercial - no charge