OVERALL RATINGS
INSTALLS
2
SUPPORT
- Partner Supported
TRUST SIGNALS
Key highlights of the appOpen alerts, alert volume, MTTA / MTTR, noisiest sources and who is on call, as widgets on your Jira dashboards
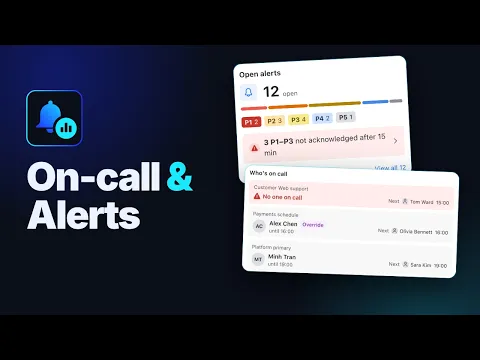
Alerts and on-call on your Jira dashboard
Open alerts by priority, alerts per day, median MTTA and MTTR, the noisiest sources, and who is on call now and next. Widgets for the new Jira dashboards, gadgets for classic ones.
The alerts behind every number
Select a number on a widget to open the Alerts page with the same filters. Filter by team, priority and status, and open any alert in Jira Service Management.
A TV mode for the team's wall screen
One full-screen dark view: P1–P3 alerts not acknowledged after 15 minutes, who is on call for each schedule, and the last 7 days. Refreshes every 1, 2 or 5 minutes; alert titles stay hidden unless you turn them on.
Supporting media
More details
For IT operations, SRE and service desk teams on Jira Service Management Standard, Premium and Enterprise.
- Open alerts by priority, and those not acknowledged in time.
- Alert volume per day or week; the last 7 days against the 7 before.
- MTTA / MTTR: median times against your targets.
- Noisiest sources, tags and repeated alerts.
- Who is on call now and next, per schedule.
- An Alerts page with filters, and a TV mode for the wall.
Widgets for the new Jira dashboards where your site has them; the same five views as gadgets for classic dashboards.
No setup: add a widget, and each person selects Allow access once. The app only reads, with each viewer's own permissions, and stores no alert data. Widgets refresh every 5 minutes, in light or dark mode. Runs on Atlassian.
Docs: https://aiverylabs.atlassian.net/wiki/spaces/OCAD/overview
Support: https://aiverylabs.atlassian.net/servicedesk/customer/portal/1/group/107
Not affiliated with or endorsed by Atlassian.
Resources
App documentation
Comprehensive set of documentation from the partner on how this app works
Privacy and Security
Privacy and security questionnaire has been filled by the partner
Privacy policy
Atlassian's privacy policy is not applicable to the use of this app. Please refer to the privacy policy provided by this app's partner.
Partner privacy policySecurity program
This app is not part of the Marketplace Bug Bounty program.
Integration permissions
On-call & Alerts Dashboard for Jira Service Management integrates with your Atlassian app
Version information
Version 3.0.0•for Jira Cloud
- Release date
- Oct 23rd 2026
- Summary
- First release: five dashboard widgets, an Alerts page and TV mode
- Details
First release of On-call & Alerts Dashboard for Jira Service Management. - Five widgets for the new Jira dashboards: Open alerts, Alert volume, MTTA / MTTR, Noisiest sources and Who's on call. - The same five views as gadgets for classic Jira dashboards. - Alerts page: tiles that filter, filters for team, priority and status, and every alert opens in Jira Service Management. - TV mode for a wall screen, refreshing every 1, 2 or 5 minutes. - Reads with each viewer's own permissions and stores no alert or on-call data. Runs on Atlassian.
- Payment model
- Paid via Atlassian
- License type
- Commercial