
OVERALL RATINGS
INSTALLS
836
SUPPORT
- Partner Supported
TRUST SIGNALS
Key highlights of the appForecast & progress graphs for Scrum/Kanban/Scaled Agile. Initiative, epic, version/release, project, sprint burndown reports
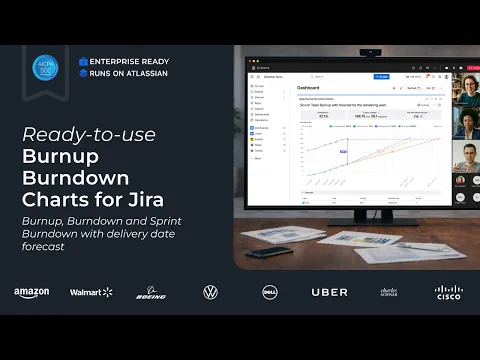
Real-time Agile forecasting in Jira Dashboard
Forecast sprints/epics/initiatives/releases, filter remaining work, model capacity allocation, compare statistical ranges to your plan, and test what-if scenarios with burnup/burndown charts, directly in Jira.
Beginner-friendly and highly customizable
Start from templates for any data source, one or multi-team workflow. Tune the calculation logic, break down results by any field & add target dates to spot delivery changes fast. Export or share.
Get the full Agile reporting in one subscription:
Combine Burnup/Burndown, Throughput, Velocity, Cycle Time, Monte Carlo forecasting, CFD, WIP, and Created vs Resolved charts on one Jira dashboard. Keep your existing dashboards and saved charts - no rework.
Supporting media
Editions
This app offers two different editions - Standard and Advanced. You can start a free trial of either edition, and change your edition anytime during or after the trial.
Standard
Onboard your team and scale fast
Includes:
Initiative-Level Forecasting
Epic Estimate
Alternative Throughput
Capacity Allocation Simulation
Forecast vs Projection Comparison
Advanced
Unlock the full range of app features
Everything from Standard, plus:
Operational SLA & Priority Queue
Strategic Enablement Sessions
Migration & Rollout Assistance
More details
🎓Get started | 📊Interactive playground | 💻Book a Demo | 🛠Support
Enterprise-ready Agile Burnup Burndown Charts byBroken Build bring real-time visibility into scope and delivery in Jira. Track progress, spot scope changes & forecast completion dates - all in one gadget with fast setup and flexible configuration.
✨ Key features:
- Multiple data sources: Scrum/Kanban, projects, releases, epics, SAFe, JQL filters
- Burnup chart: track completed work vs scope over time
- Burndown chart: track remaining work vs scope
- Sprint burndown chart: monitor sprint progress and completion
- Calculation rules: customize done statuses, scope logic & estimates
- Progress/Health metrics & Targets: monitor performance, delivery health & set targets
- Breakdown&issue list: segment data by any issue field and drill down to Jira issues
Built for multi-team and enterprise environments, enabling consistent Burnup Burndown & Sprint burndown reports in Jira - all in one gadget.
Resources
App documentation
Comprehensive set of documentation from the partner on how this app works
Privacy and Security
Privacy policy
Atlassian's privacy policy is not applicable to the use of this app. Please refer to the privacy policy provided by this app's partner.
Partner privacy policySecurity program
This app is part of the Marketplace Bug Bounty program.
About Bug Bounty programIntegration permissions
Burnup Burndown charts: forecasting in Jira Dashboard gadget integrates with your Atlassian app
Version information
Version 4.20.0•for Jira Cloud
- Release date
- Apr 14th 2026
- Summary
- Support fixes
- Details
- Payment model
- Paid via Atlassian
- License type
- Commercial