
OVERALL RATINGS
INSTALLS
819
SUPPORT
- Partner Supported
TRUST SIGNALS
Key highlights of the appTime in Status Reports/Average Time in status/Time to resolution, Trend, Cycle time and Lead time gadgets/charts on Jira Dashboard
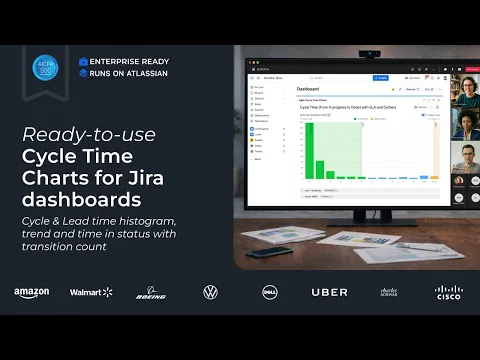
Real-time flow efficiency & time reporting in Jira
Model Cycle/Lead Time with event-based start/end rules. Analyze Time in Status (absolute/ratio/average), time to SLA, assignee time. Track transition counts, and drill down by any field - directly in Jira.
Beginner-friendly and highly customizable charts
Start from templates, then tailor the logic to the workflow: define timing rules, add targets/SLA. Share/export Cycle/Lead time, status time analytics, time between statuses charts from one gadget.
Get the full Agile reporting in one subscription:
Combine Cycle Time & Time in Status with Throughput, Velocity, Burnup/Burndown, Monte Carlo forecasting, CFD, WIP & Created Resolved charts on one Jira dashboard. Keep your existing saved charts - no rework.
Supporting media
Editions
This app offers two different editions - Standard and Advanced. You can start a free trial of either edition, and change your edition anytime during or after the trial.
Standard
Onboard your team and scale fast
Includes:
Event-Based Cycle & Lead Time Modeling
Cycle & Lead Time Trend
Time in Status (Abs, Ratio, Avg)
Work Schedule
Transition Count & Breakdown
Advanced
Unlock the full range of app features
Everything from Standard, plus:
Operational SLA & Priority Queue
Strategic Enablement Sessions
Migration & Rollout Assistance
More details
🎓Get started | 📊Interactive playground | 💻Book a Demo | 🛠Support
Agile Cycle Time Charts by Broken Build bring Сycle/Lead time and Time in Status analytics into one Jira gadget - with fast setup and flexible configuration.
🌟 Key features:
- Multiple data sources: Scrum/Kanban, projects, releases, epics, SAFe, JQL
- Cycle time histogram chart:assess delivery predictability and spot patterns
- Cycle time trend chart: analyze percentiles to assess predictability and trends
- Time in status chart: track time across workflow stages & spot bottlenecks
- Calculation rules: customize timers, statuses & logic
- Highlights & Targets: visualize key time/percentile ranges and track goals/SLAs directly on the chart
- Breakdown&Issue list: break down results by any issue field and drill down to Jira issues for deeper insights
Built for multi-team and enterprise environments, enabling consistent Lead/Cycle time & Time in Status reports in Jira - all in one gadget.
Resources
App documentation
Comprehensive set of documentation from the partner on how this app works
Privacy and Security
Privacy policy
Atlassian's privacy policy is not applicable to the use of this app. Please refer to the privacy policy provided by this app's partner.
Partner privacy policySecurity program
This app is part of the Marketplace Bug Bounty program.
About Bug Bounty programIntegration permissions
Time in Status report, Cycle Time & Lead Time Chart for Jira integrates with your Atlassian app
Version information
Version 9.30.0•for Jira Cloud
- Release date
- Mar 19th 2026
- Summary
- Stability and usability improvements
- Details
- Payment model
- Paid via Atlassian
- License type
- Commercial