OVERALL RATINGS
INSTALLS
104
SUPPORT
- Partner Supported
TRUST SIGNALS
Key highlights of the appElevate your report: Custom Charts / Chart & Gadgets! Visualize your data in various ways using extensive types of charts provided

Track and Analyze Data from Projects or Filters
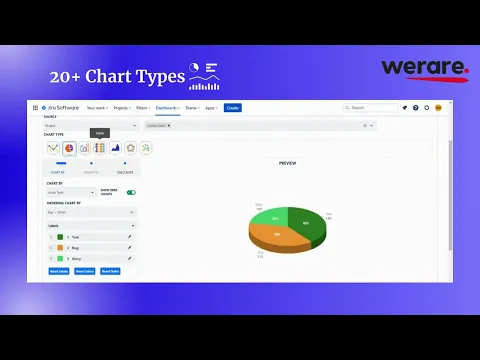
Display key metrics on Jira dashboards using data from projects or filters. Choose from 20+ chart types to customize and analyze your data effectively, enhancing tracking and decision-making.
Transform Your Data with 20+ Chart Option
Visualize your data with 20+ customizable chart types like pie, bar, and radar charts. Tailor labels, colors, and filters to create detailed insights and improve your tracking and reporting efficiency.
Personalize Your Charts Easily
Personalize your charts with ease: rename labels, hide unnecessary segments, customize colors, and adjust the order. Create visuals that fit your data perfectly for better insights and tracking.
Supporting media
More details
Custom Dashboard and Gadgets provides Jira users with a convenient and intuitive chart gadget that allows them to create various types of charts, including bar charts, pie charts, and more. With just a few clicks, users can easily generate custom charts that represent their Jira data in a clear and visually appealing way.
Once created, these charts can be added to the user's Jira dashboard for quick and easy access, allowing them to monitor and analyze their data at a glance.
20+ chart types available:
- Line Charts
- 1D Line/Dashed Line
- 2D Line/Dashed Line
- 1D/2D Vertical Line
- Pie Charts:
- Regular Pie
- 3D Pie
- Doughnut
- Sun Brust Chart
- Tables
- 1D/2D Table
- Heatmap
- Bar Charts:
- 1D/2D Horizontal Bar
- 1D/2D Vertical Bar
- 2D Multi Bar Chart
- 2D Stacked Bar Chart
- Radar/Radial Charts
- Radial Chart
- 2D Radar Chart
- Area Charts
- Polar
- Area Chart
- Vertical Area Chart
- Other Types:
- Scatter Chart
- Bubble Chart
- Funnel Chart
Also with Custom JQL option, it provides you with a more customized grouping of your data.
Resources
App documentation
Comprehensive set of documentation from the partner on how this app works
Privacy and Security
Privacy policy
Atlassian's privacy policy is not applicable to the use of this app. Please refer to the privacy policy provided by this app's partner.
Partner privacy policySecurity program
This app is part of the Marketplace Bug Bounty program.
About Bug Bounty programIntegration permissions
Custom Dashboard Charts and Gadgets integrates with your Atlassian app
Version information
Version 8.1.0•for Jira Cloud
- Release date
- Dec 5th 2025
- Summary
- Minor version update
- Details
- Minor version update
- Payment model
- Paid via Atlassian
- License type
- Commercial