Velocity Chart for Confluence (Individual/Team/Cross-Team)
OVERALL RATINGS
INSTALLS
70
SUPPORT
- Partner Supported
Key highlights of the appExtensive sprint velocity report macros:10 metrics, benchmarks, breakdowns,sprint status. Scrum/Kanban/SAFe/Scaled Agile analytics
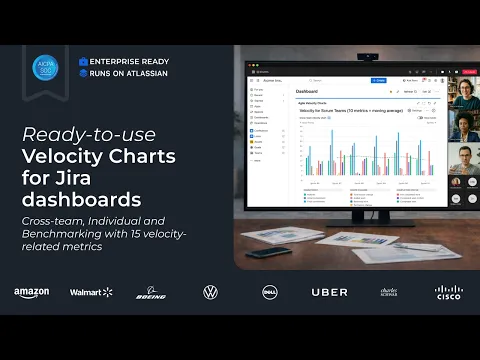
Real-time Agile velocity reporting in Jira
Track initial vs final sprint commitment, completed vs not completed work, configurable Say/Do ratio, rollover & scope change, and team/individual benchmarks - inside Jira, no exports or integrations.
Beginner-friendly and highly customizable
Create Velocity charts from templates. Set up in 3 clicks, break down metrics by any field, and add targets to monitor delivery health. Share or export.
SAFe, Enterprise support
Track delivery capacity across every level of the hierarchy. Support Epic points, multiple data sources (Scrum/Sprints, Kanban, Epics, Releases, Initiatives), and custom estimation models.
Supporting media
More details
🎓Get started | 📊Interactive playground | 💻Book a Demo | 🛠Support
Enterprise-ready Agile Velocity Charts by Broken Build show delivery trends with real-time visibility across sprints and periods. Compare teams/individuals, benchmark results, & set realistic targets in Jira.
✨ Key features:
- 10 sprint metrics: rollover, scope & estimation changes, say-do ratio
- Multiple data sources: Scrum/Kanban, projects, releases, epics, SAFe, JQL filters
- Cross-team velocity chart: compare throughput trends and delivery consistency
- Individual velocity chart: track individual performance and workload distribution
- Benchmarking velocity chart: compare team performance with avg, median, percentiles
- Calculation rules: customize estimates, statuses, and logic
- Breakdown & issue list: segment data by any issue field and drill down to Jira issues
Get the full Agile reporting suite: 9 essential chart types with 38 templates in one Agile Reports & Gadgets bundle.
Resources
Descriptor
Get the descriptor file downloaded to your system
App documentation
Comprehensive set of documentation from the partner on how this app works
Privacy and Security
Privacy policy
Atlassian's privacy policy is not applicable to the use of this app. Please refer to the privacy policy provided by this app's partner.
Partner privacy policySecurity program
This app is not part of the Marketplace Bug Bounty program.
Integration permissions
Velocity Chart for Confluence (Individual/Team/Cross-Team) integrates with your Atlassian app
Version information
Version 1.0.51-AC•for Confluence Cloud
- Release date
- Nov 11th 2024
- Summary
- Cross-team Velocity Chart for Kanban boards
- Details
You can now visualize your Kanban team’s performance just like you do for Scrum teams. Start by visiting the Getting Started page, or find the gadget on your Jira Dashboard.
The gadget includes one primary metric—Completed work—along with other familiar key features such as:
- Moving average
- Target lines
- Breakdown
And many more.
- Payment model
- Paid via Atlassian
- License type
- Commercial