
Additional time may be available from the app vendor.
About Data Center trials
OVERALL RATINGS
INSTALLS
373
SUPPORT
- Partner Supported
Key highlights of the appSmart SLA tracking & Service Management metrics with interactive dashboard gadgets & reports
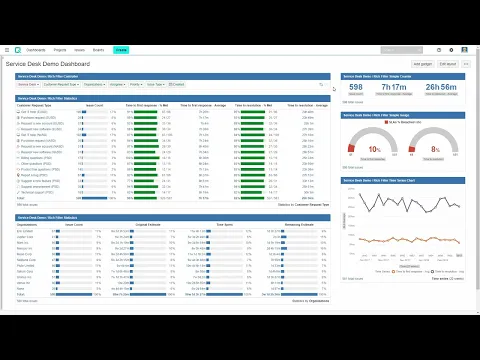
Dynamic filters & statistics for JSD fields
Extend your Rich Filters for Jira Dashboards charts and reporting with functionality specific to Jira Service Management. You can now add dashboard filters and statistics on Customer Request Types & Organizations.
Charts, metrics & stats for SLA reporting
Monitor the performance of your help desk teams with stats, charts & metrics based on SLA fields. Focus on one or several SLA fields and on different SLA values – Met, Breached, %Met, %Breached, Average. Export to PDF.
Single & cross-project SLA time series
Use time series to point out trends and hint at correlations & tendencies in your Service Management activity. Define time series metrics based on SLA fields to monitor SLA values across single or multiple service desks.
Supporting media
More details
Rich Filters::Service Management Dashboards is an extension for the Rich Filters for Jira Dashboards app.
Now you can add dashboard quick filters or build statistics using:
- Customer Request Type and Organization fields
- Service Management SLA field values & completion dates
- Time series based on Service Management SLA values
These are added on top of the existing Rich Filters for Jira Dashboards key features: quick filters on dashboards, colors, tags & views, advanced stats & charts, export to Excel and more.
————————————————
⚠️BEFORE YOU INSTALL
- Rich Filters for Jira Dashboards MUST be installed with a valid license to run this extension
- Note: You must re-index your Jira instance after installing the app!
————————————————
Discover the other Rich Filters extensions:
The Appfire platform features dozens of top-selling apps that help teams worldwide solve big challenges.
Resources
Download
Get the .jar file downloaded to your system
App documentation
Comprehensive set of documentation from the partner on how this app works
Privacy and Security
Privacy policy
Atlassian's privacy policy is not applicable to the use of this app. Please refer to the privacy policy provided by this app's partner.
Partner privacy policySecurity program
This app is part of the Marketplace Bug Bounty program.
About Bug Bounty programVersion information
Version 1.3.2•for Jira Data Center 9.10.0 - 10.7.4
- Release date
- Jul 9th 2025
- Summary
- Minor improvements
- Details
- Minor improvements
Don't have Rich Filters::Service Management Dashboards v1.3 yet? Check out the highlights in the detailed release notes.
- Payment model
- Paid via Atlassian