
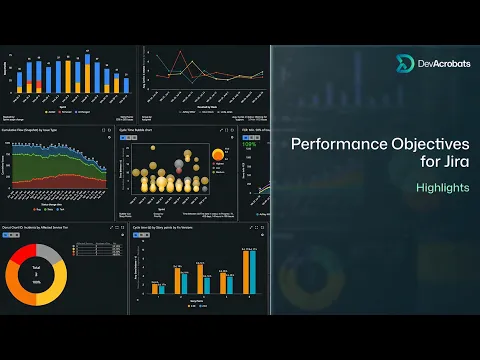
Performance Objectives: Charts & Reports for Jira Dashboards

- Supported
- Jira Service Management
- Jira
Easy reports, custom charts, SLA and OKR metrics for Jira Dashboards. Sprint velocity, Time in status & Time tracking KPIs
ITSM Custom Analytics for Jira Service Management
SLA Metrics, Time in status, Cycles in status, Time tracking, Time in assignee, Cycles in assignee, Time between dates, Time since/Age of, Formula metrics, Conditional metrics, Multiple metrics, Average & Moving average
Agile KPIs and Custom Dashboards for Jira Software
Cycles in sprint, New & Rolling Story Points, Resolved & Unresolved in Sprint, Sprint Scope Change (Added, Removed, Unchanged). Display by First, Last or Resolved in Sprint. Open issues overtime in status / assignee.
Timesheet and Worklog Custom Reports for Jira
Dark theme, JQL search, Team calendars and custom targets. Custom color palette, color change and chart reorder. Historic & Period over period analysis, Trend charts, Cumulative mode, Moving average, + more.
More details
Selection of the KPIs you can set and monitor in real-time on Jira dashboard:
- Say-do Ratio
- Sprint Rollover Ratio
- Team and Individual Velocity
- Committed vs. Completed SP
- Defect Removal Efficiency
- % High Severity Defects
- Cycle Time, Lead Time
- Time in Status KPIs
- Work Log Time by Work log Author
- Mean Time to Resolve
- Max Issue Age
- Period over Period Improvement
- First Response Time
- First Contact Resolution
- Busiest Hours for Support Requests
- Breached Issues by Breached Time Ranges and many more.
Explore examples and gain inspiration for your custom KPIs on our website and YouTube Channel, or contact us for help with your challenging reports.
- JQL data segmentation and multiple filters
- Various target types and threshold (optional)
- Custom colors, reordering, metric formatting, custom labels, export and more.
Supported chart types: Pie, Donut, Line, Area, Bar, Heat Map, Tree Map, Bubble, Scatter, Venn, etc.
No new custom fields added. No client data sent outside your Jira.
Certification
This app offers additional security, reliability, and support through:
- Cloud security participation
- Reliability checks
- 24hr support response time
- and more.
Privacy and security
Privacy policy
Atlassian's privacy policy is not applicable to the use of this app. Please refer to the privacy policy provided by this app's partner.
Partner privacy policyResources
Integration Details
Performance Objectives: Charts & Reports for Jira Dashboards integrates with your Atlassian product. This remote service can:
- Write data to the host application
- Read data from the host application
Gallery
Dashboard gadgets for Bar / Column, Line, Area, Pie, Donut, Bubble, Heat map, Tree map, Venn diagram, Scatter, Windrose, Radial bar charts.