OVERALL RATINGS
INSTALLS
70
SUPPORT
- Partner Supported
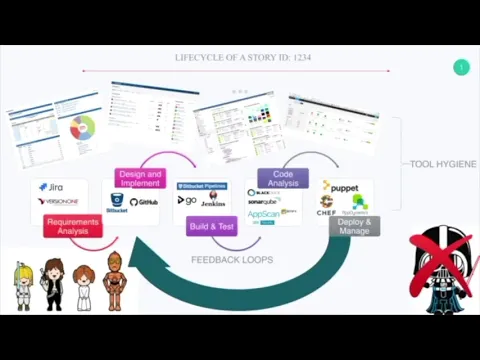
Key highlights of the appView Stories, Commits, Build, Code Quality & Test Coverage metrics in Jira from GitHub, BitBucket, SonarQube, Jenkins, & Travis CI

Builds in Jenkins, Travis or Bitbucket pipelines
View successful, failed and stopped builds triggered by commits. Fix issues in build failures. Improve delivery speed by analyzing and reducing average build durations. Track team performance by deployment frequency data
View Code Commits & Pull Requests by Developer
View code committed by a developer inside Jira. View number of commits by developer. Summary of Git commits, pull requests & branches related to the jira issue. Assess number of inserts, deletes & files changed by commit
Visualize Code Quality and Test Coverage over time
Visualize your software's code quality and test coverage in real time and over time in Jira. Improve your software quality and increase test automation. Increase transparency and delivery in your software development
Supporting media
More details
- Integration with Jira, GitHub, Bitbucket Pipelines, Jenkins, Travis, SonarCloud & SonarQube
- View stories, code commits, code reviews, builds, code quality & test coverage for your software in a sprint for real time and trends view
- Software teams can view real time status of their stories, bugs, code commits, code reviews, builds, test coverage & code quality on a single page
- Teams can see their software delivery pipeline
- Development Leads, Project Managers, Product Owners & ScrumMasters can analyze release history, story burn down for Epics or Components, Code commits, Code Quality & Test coverage to visualize software quality
- Powerful reporting of software development data for projects in Jira Cloud
- View Code Commits, Reviews & Contribution by Developer
- View Code Quality, SQALE Rating, Test Coverage, Documentation & Code Duplication
- View Builds Success & Average Duration
- Fully documented and supported by vendor
Resources
App documentation
Comprehensive set of documentation from the partner on how this app works
Privacy and Security
Privacy policy
Atlassian's privacy policy is not applicable to the use of this app. Please refer to the privacy policy provided by this app's partner.
Partner privacy policySecurity program
This app is not part of the Marketplace Bug Bounty program.
Integration permissions
At a Glance Telemetry Dashboard for Jira integrates with your Atlassian app
Version information
Version 2.6.0•for Jira Cloud
- Release date
- Oct 2nd 2025
- Summary
- Minor version update
- Details
- Minor version update
- Payment model
- Paid via Atlassian
- License type
- Commercial