OVERALL RATINGS
INSTALLS
60
We no longer offer sales and support for server apps. You can stay connected by exploring the migration options to either the cloud or Data Center version of this app.
Key highlights of the appAdd Zabbix graphs, items and triggers to your Confluence pages
Import graphs, items and triggers from Zabbix
Import graphs, items and triggers from Zabbix and place important details of your IT infrastructure in one place
Combine imported data with configuration details
Have your configuration database complemented by "live" data and graphs from Zabbix
Make complex presentations and reports
Build complex reports and data views to meet your analytical and/or business requirements
More details
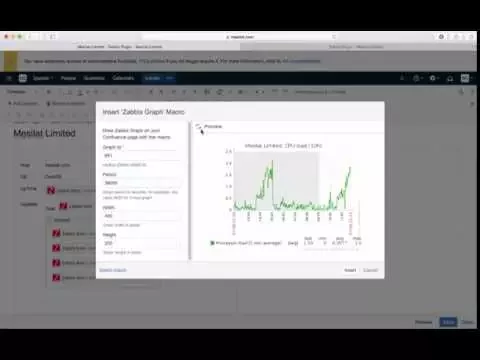
There are many of us sysadmins out there who use Confluence as a primary source of information about their hardware and software -- the type of information that would likely contain installation instructions, configuration files, performance reports and other valuable bits and pieces of information. This is usually accompanied by network monitoring tools such as Nagios or Zabbix. This plugin is used to add Zabbix charts (or graphs) to Confluence to illustrate configuration details and reports with online visual information. It is also possible to import text information from Zabbix – such as Zabbix items and alerts (or triggers). For more information please visit About Zabbix Plugin page.
Resources
Download
Get the .jar file downloaded to your system
App documentation
Comprehensive set of documentation from the partner on how this app works
Privacy and Security
Privacy policy
Atlassian's privacy policy is not applicable to the use of this app. Please refer to the privacy policy provided by this app's partner.
Partner privacy policySecurity program
This app is not part of the Marketplace Bug Bounty program.
Version information
We no longer offer sales and support for server apps. You can still explore the earlier versions but these may not offer the necessary support.