Agile Charts & Gadgets: Reports, Graphs, KPIs on Dashboard

Additional time may be available from the app vendor.
About Data Center trials
OVERALL RATINGS
INSTALLS
1,341
SUPPORT
- Partner Supported
- Cloud Migration Assistance
TRUST SIGNALS
Key highlights of the appAgile tools/reports/charts for Scrum/Sprints, Kanban, Projects, Epics, Releases, Initiatives, SAFe analytics & forecasts in Jira
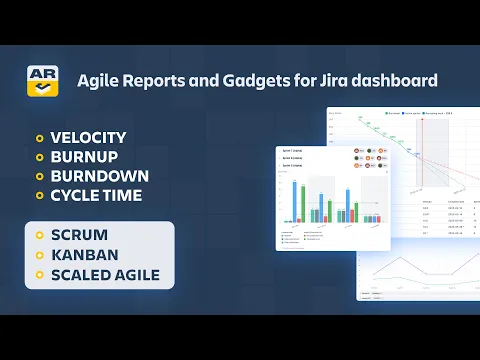
Velocity, burnup, burndown, cycle time, benchmarks
“Agile Reports & Gadgets” app includes functionality of these apps:
Breakdown the work for deeper analysis
Slice-and-dice analytics with multi-level breakdown by:
✔ issue types (story, bug, task, etc)
✔ priorities
✔ Jira projects
✔ or any Jira field (assignee, label, component, etc)
Reports that fit any Jira setup
✔ Create reports for Scrum, Kanban, or Scaled Agile setup in Jira
✔ Choose estimation units (story points, issue count, original/remaining time, etc)
✔ Fine-tune charts with comprehensive settings
Supporting media
More details
🚀Blog post about 7.x major release
📗Documentation and Support
🌟 Get 12 advanced Agile charts as Jira Dashboard gadgets, standalone reports or Confluence macros.
🌟 Key features:
- Data sources: multiple scrum and kanban boards, custom JQL, Initiatives or any entity above the Epic
- Velocity, burnup, and burndown for a cross-team, individual, sprint, release, epic, and custom scope level
- Benchmarking chart: compare teams & set KPIs
- 10 sprint metrics (with averages): rollovers, scope & estimation changes, say-do ratio
- 3-level breakdown to analyze sprint data by:
- issue type breakdown (bug, story, task)
- what work is rolled over to the next sprint
- what P1 bugs were fixed in a sprint, month, quarter
- releases, epics, labels, etc.
- Story points, issue count, integrated time estimates (accounts for Original & Remaining estimates) or any numeric Jira field
- Sprint, month, or quarter intervals
Resources
Download
Get the .jar file downloaded to your system
App documentation
Comprehensive set of documentation from the partner on how this app works
Privacy and Security
Privacy policy
Atlassian's privacy policy is not applicable to the use of this app. Please refer to the privacy policy provided by this app's partner.
Partner privacy policySecurity program
This app is not part of the Marketplace Bug Bounty program.
Version information
Version 9.0.0•for Jira Data Center 8.20.0 - 11.3.4
- Release date
- Mar 30th 2026
- Summary
- Created vs. Resolved and Work In Progress charts
- Details
With Created vs. Resolved and Work In Progress charts, this release completes the broader reporting toolset, alongside cross-team and individual Velocity, Burnup/Burndown, Cycle Time, Time in Status, Cumulative Flow, Throughput, and Monte Carlo charts, forming a comprehensive system for understanding delivery across multiple dimensions. Not just activity. Not just output. But the system's condition and behavior as a whole.
Here are some examples of charts and useful features you can get with this update:
Created vs. Resolved charts
- Compare Arrivals to Departures to spot system changes
- Understand Created vs. Resolved on the by-period chart
- Configurable Arrival & Departure metrics
- Breakdown to See Where Capacity Goes
Work In Progress charts
- Drive daily discussions looking at the WIP Aging chart with Health zones
- Catch at-risk work early using a breakdown and an issue list
- Configure which part of the flow you want to put in the spotlight
- Payment model
- Paid via Atlassian
- License type
- Commercial